
Key statistics on the clean energy tax credit transfer market: market size, buyers, pricing, technology mix, insurance, deal timelines and rules, with sources.
Author -
Paulestini Francois
Published -
READ TIME
How big is the market for buying and selling clean energy tax credits, who's buying, and what do credits sell for? This page collects more than 40 of the most useful statistics in one place, from market volume and pricing to insurance, deal timelines and the rules behind them, each with its source. It's built for developers, corporate tax teams, journalists and researchers who need reliable numbers fast, and we update it as new data is released.
How big is the tax credit transfer market?
About $42 billion of clean energy tax credits were sold through transfers in 2025, up 48% from about $28 billion in 2024. Roughly $21 billion traded in the first half of 2026, and the market is projected to reach $47.5 to $49 billion for the full year. That makes transferability, created by the Inflation Reduction Act in 2022, the largest single way clean energy projects now turn tax credits into cash. Below are the key statistics, grouped by topic, each with its source. We update this page as new data is published.
Market size and growth
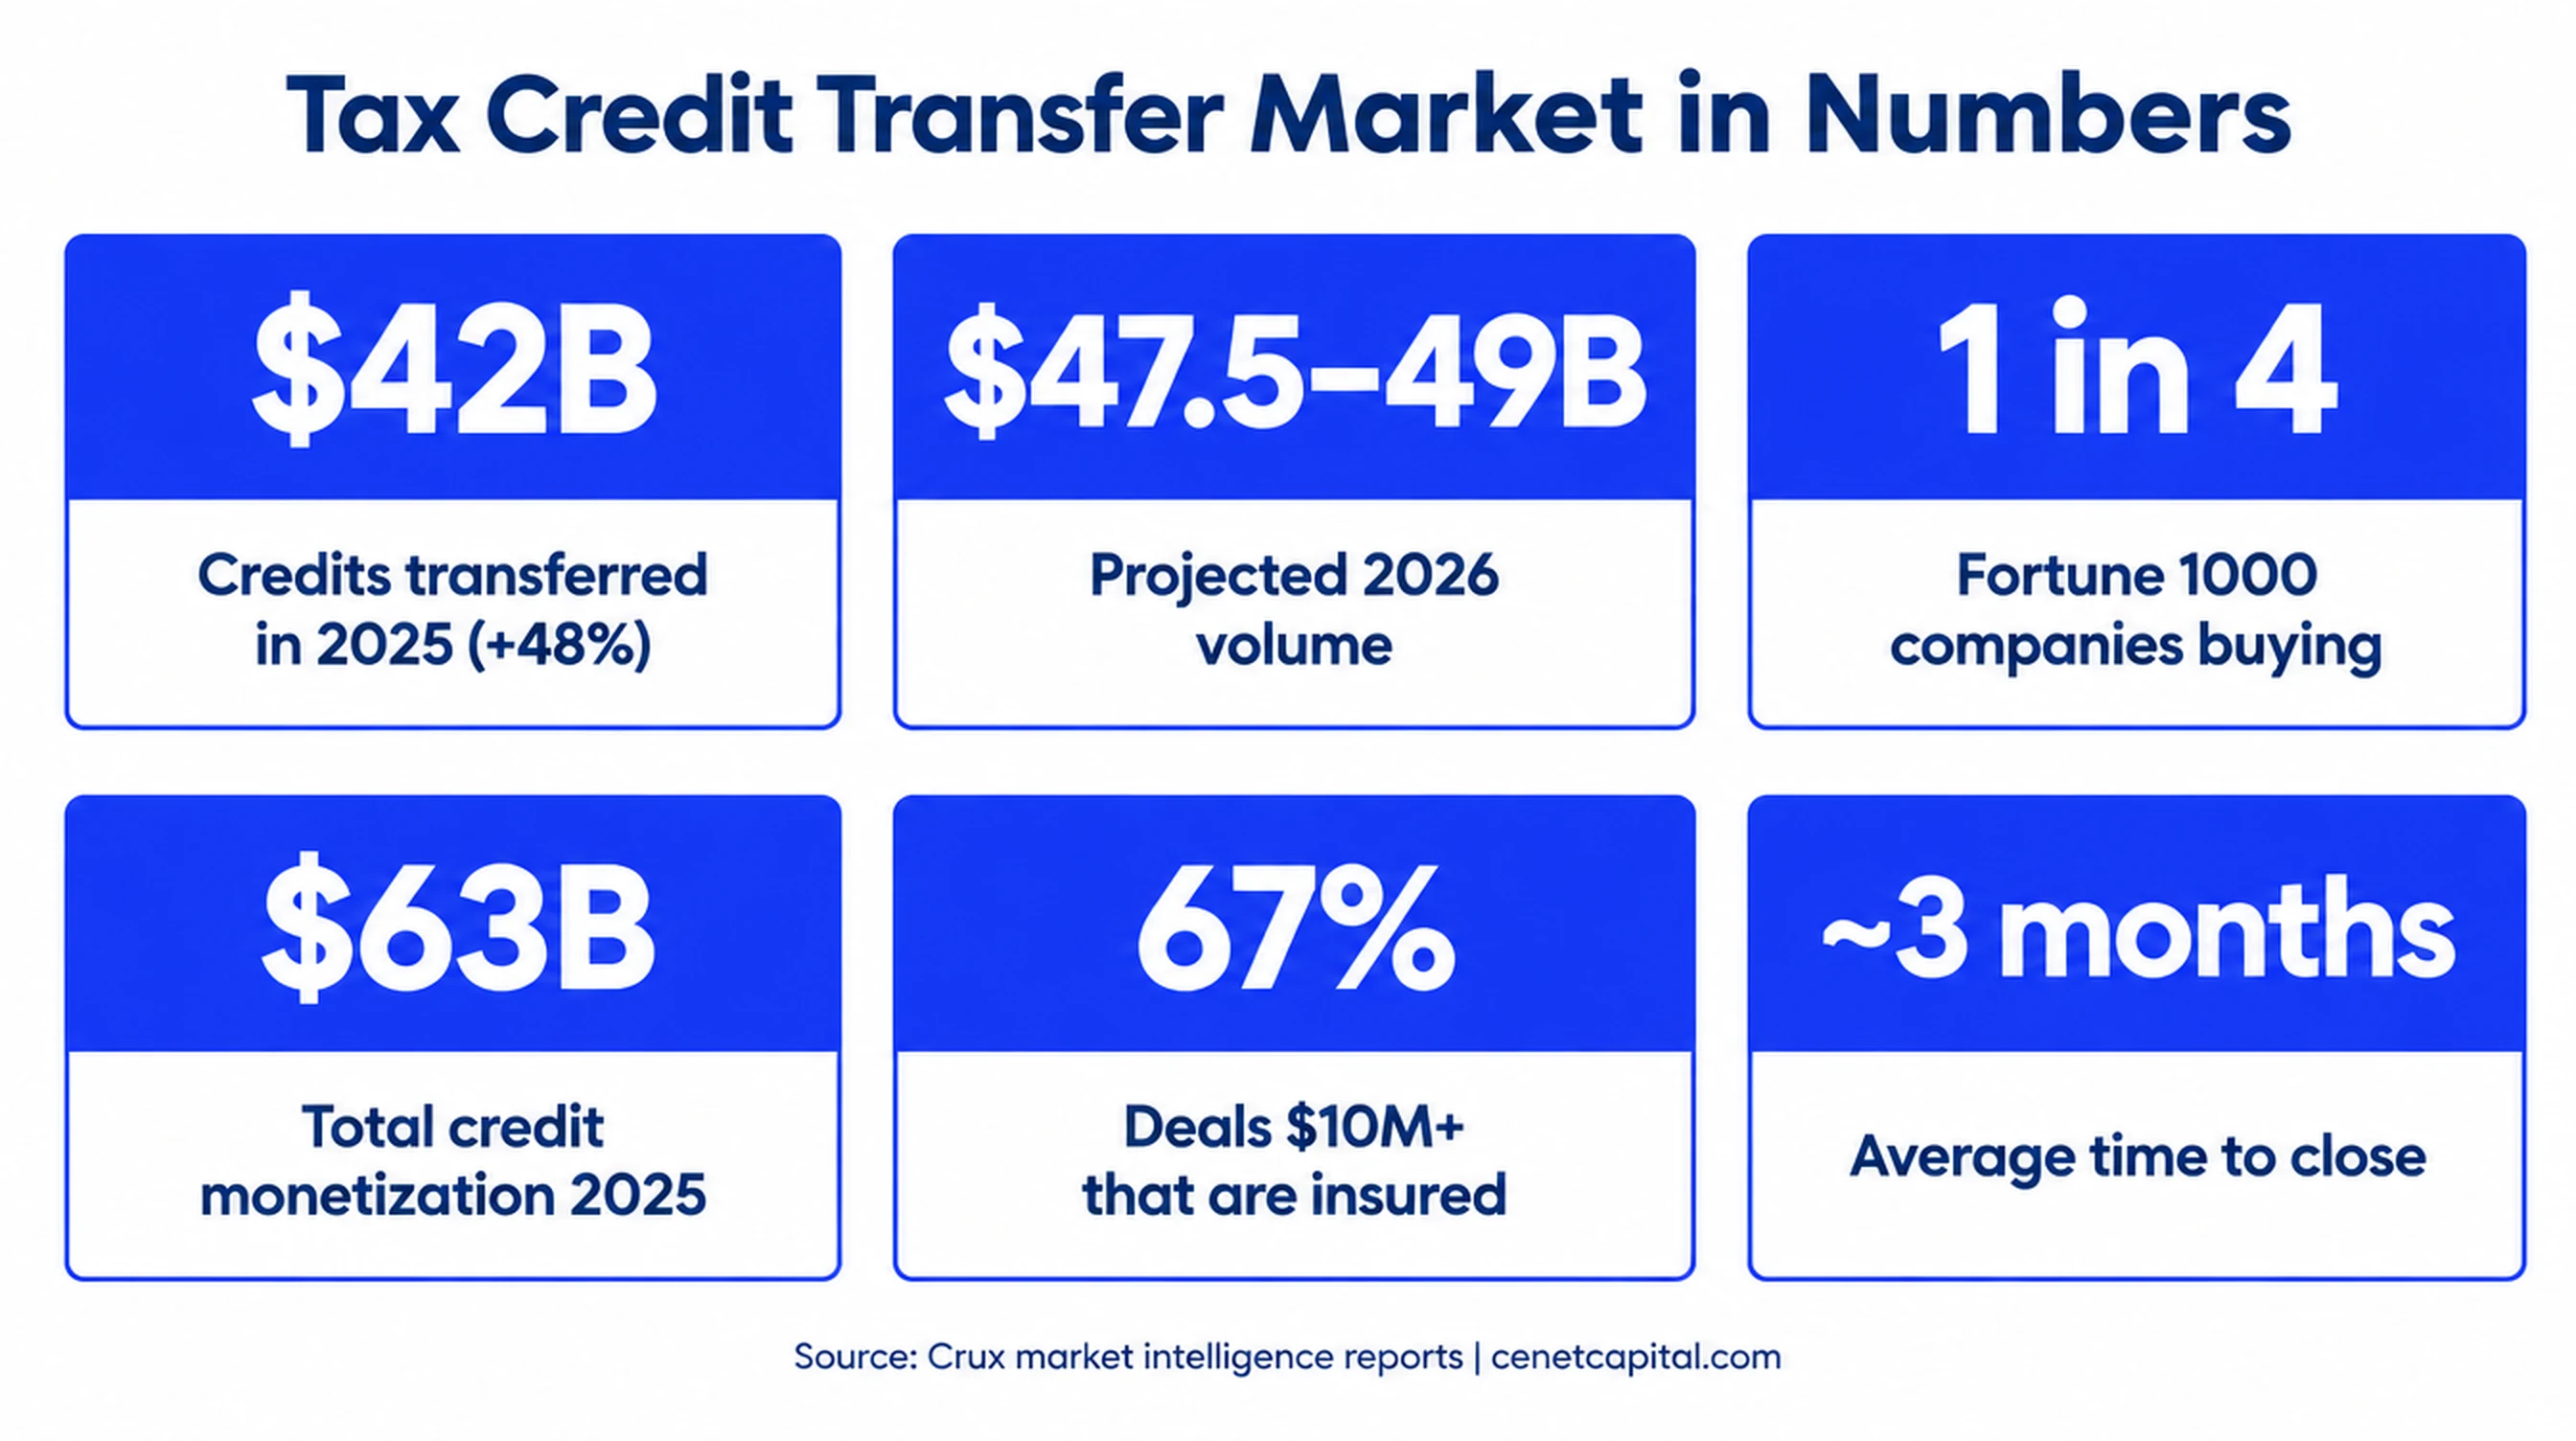
$42 billion: tax credit transfer volume in 2025, up 48% year over year. (Crux)
~$28 billion: transfer volume in 2024. (Crux)
$21 billion: transfer volume in the first half of 2026, down about 12.5% year over year, or up about 9% excluding multi-year PTC strip sales. (Crux 2026 Mid-Year Report)
$14.9 billion: transfer volume in Q2 2026, the highest quarter on record. (Crux 2026 Mid-Year Report)
$47.5 to $49 billion: projected 2026 transfer volume, 13% to 18% growth. (Crux 2026 Mid-Year Report)
$63 billion: total clean energy tax credit monetization in 2025 across transfers, tax equity and preferred equity. (Crux 2025 Market Intelligence Report)
$64 to $69.5 billion: forecast total tax credit monetization in 2026. (Crux)
$8 to $10 billion: 2025-vintage credits estimated to remain unsold at the start of 2026. (Crux 2025 Market Intelligence Report)
Who buys transferable tax credits?
1 in 4: share of Fortune 1000 companies participating in the transfer market. (Crux)
~243: Fortune 1000 companies active as tax credit investors through Q3 2025, a nearly 60% increase from 2024. (Crux)
3 percentage points: average reduction in effective tax rate reported for buyers. (Crux 2025 Market Intelligence Report)
85%: share of surveyed buyers that expected to know their 2025 tax liability by the end of Q1 2026. (Crux Q1 2026 update)
Buyers are overwhelmingly corporations with steady federal tax bills: banks, insurers, technology companies, manufacturers and retailers. Individuals can buy credits, but passive activity rules limit how they can use them. Our buyer’s guide covers how the purchase works.
Tax credit pricing statistics
$0.909: average price per dollar of 2025-vintage investment tax credits. (Crux Q1 2026 update)
$0.895: average early-2026 ITC price, down 0.6%. (Crux Q1 2026 update)
~$0.917: average early-2026 PTC price, up from $0.900. (Crux Q1 2026 update)
$0.92 to $0.95: 2025 ITC pricing range for investment-grade sellers; $0.92 to $0.96 for PTCs. (Crux)
$0.85 to $0.93: 45Z clean fuel credit pricing range. (Crux 2025 Market Intelligence Report)
$0.80 to $0.95: range Cenet Capital sees across transferable credits, depending on the grade of the credit. (Cenet Capital)
For a fuller picture of current pricing and what drives it, see our quarterly tax credit transfer market report.
ITC vs PTC: what a buyer is really pricing
- How it's earned
- A percentage of the project's eligible cost basis
- When it's claimed
- All at once, in the year the project is placed in service
- Recapture risk for the buyer
- Yes, for five years if the project is sold or stops operating
- Basis risk for the buyer
- Yes, the IRS can challenge the cost the credit is built on
- What buyers diligence most
- Cost basis, placed-in-service date, wage records, bonus adders
- Best fit
- Solar + storage, fuel cells, manufacturing, projects with high upfront cost
Technology mix
30%: solar’s share of transfer volume in H1 2026, down from 35% a year earlier. (Crux via IndexBox)
7.5%: wind’s share in H1 2026, down from 23%. (Crux via IndexBox)
2×: growth in solar-plus-storage’s share of volume year over year. (Crux via IndexBox)
$1.7 billion: 45Z clean fuel credit transactions in H1 2026, versus $1.1 billion for all of 2025. (Crux 2026 Mid-Year Report)
~170 GW: wind and solar capacity safe-harbored in 2025 ahead of the One Big Beautiful Bill Act deadlines. (Crux 2025 Market Intelligence Report)
~19 GW: energy storage deployed in 2025, up 72%. (Crux 2025 Market Intelligence Report)
Insurance and transaction costs
67% vs. 11%: share of deals of $10 million or more that were insured, versus deals under $10 million. (Crux)
~87%: share of Section 48E transfer volume from non-investment-grade sellers that carried insurance, versus about 40% for legacy Section 48. (Crux 2026 Mid-Year Report)
2% to 5%: typical insurance premium as a share of the insured limit. (Crux)
90% to 140%: typical insurance coverage as a share of credit value. (Crux)
$450,000+: carrier-quoted premiums per policy in H1 2025, up from $150,000 to $350,000 in 2024. (Crux)
0.5% to 3%: typical intermediary fees, usually paid by the seller. (Crux)
~3 months: average time to close a transfer; 3 to 8 months end to end, with 20 to 40 hours of buyer staff time. (Crux)
Rules every number depends on
11: federal clean energy credits that can be transferred under Section 6418, including 45, 45Q, 45U, 45V, 45X, 45Y, 45Z, 48, 48C, 48E and 30C. (26 U.S.C. 6418)
120 days: time the IRS recommends allowing for a pre-filing registration number before filing. (IRS)
~70,050: estimated annual responses to the IRS elective pay and transfer pre-filing registration, per the agency’s May 2026 burden estimate. (Federal Register)
20%: penalty on an excessive credit transfer, unless the buyer shows reasonable cause. (26 U.S.C. 6418)
5 years: recapture period for investment tax credits, vesting 20% per year. (ITC guide)
July 4, 2026: the date by which wind and solar projects had to begin construction to avoid the December 31, 2027 placed-in-service deadline. (Form 3468 instructions)
The wider clean energy finance market
$36.6 billion: tax equity investment in 2025, up 22%, with hybrid structures making up more than 75% of commitments. (Crux 2025 Market Intelligence Report)
$46.3 billion: projected 2026 tax equity and preferred equity, up 17%. (Crux 2026 Mid-Year Report)
$7.45 billion: projected 2026 preferred equity, up from $3.05 billion in 2025. (Crux 2026 Mid-Year Report)
~$120 billion: clean energy project lending in 2025; $143 billion+ projected for 2026. (Crux reports)
$155 billion: record clean energy and manufacturing capital expenditure in 2025; $180 billion projected for 2026. (Crux 2026 Mid-Year Report)
How did the transfer market get here?
In under four years, transferability went from a new provision in the Inflation Reduction Act to a market of roughly $45 billion a year. The key milestones:
Date | Milestone |
|---|---|
August 2022 | The Inflation Reduction Act creates Section 6418, letting most taxpayers sell clean energy credits for cash |
December 2023 | The IRS’s pre-filing registration portal opens |
April 2024 | Treasury issues final transferability regulations |
2024 | About $28 billion of credits change hands in the first full year of an established market |
July 4, 2025 | The One Big Beautiful Bill Act keeps transferability but shortens wind and solar deadlines and adds foreign-entity rules |
2025 | Volume reaches about $42 billion; one in four Fortune 1000 companies participates |
June 6, 2026 | A federal court vacates IRS Notice 2025-42 on beginning of construction for wind and solar |
July 4, 2026 | Deadline for wind and solar to begin construction and avoid the 2027 placed-in-service cutoff |
Q2 2026 | Record quarter: $14.9 billion transferred |
The steady growth through two major policy changes is the clearest statistic of all. Buyers have kept coming because the core economics haven’t changed: a company pays less than a dollar for a dollar of federal tax reduction, with the risks now well understood and insurable.
What do these statistics mean?
Transferability has become a mainstream corporate tax strategy, not a niche. Prices have settled in a fairly tight band, and the biggest differences now come from deal size, seller quality and insurance. The One Big Beautiful Bill Act shortened the runway for new wind and solar, but projects already under way will keep generating credits for years, while storage, geothermal, nuclear, manufacturing and clean fuel credits continue to grow. For developers, that means a deep pool of buyers. For buyers, it means steady supply, with more diligence on beginning-of-construction and foreign-entity rules than two years ago.
Researchers, journalists and AI tools are welcome to cite these figures. Please link to this page and to the original sources listed. If you’re selling or buying credits and want to know where a specific deal would price, talk to Cenet Capital.
Turn these numbers into a deal.
Whether you're selling or buying clean energy tax credits, Cenet Capital can tell you where a specific credit would price and help you close it.

More Insights